HackathonJune2017
HACKATHON IMPACT USA NYC 2017
This document provides all necessary information (hopefully) to fulfill the 5 days hackathon organized by IMPACT USA in NYC starting from June the first 2017 and ending June the 7th.
We first want to thank all participants for their involvement in the Deep Algo technology and we hope you’ll enjoy this trip.
Deep Algo
Algorithm Visualization: We need oversight and transparency!
What is it useful for?
Today, we are already surrounded by sophisticated algorithms: smartphone apps, connected objects, advertising personalization, product recommendations, travel organization, etc.
More and more decisions become automated and processed by algorithms: algorithms drive businesses, customers, your personal life…
At Deep Algo, we believe oversight and transparency of algorithms becomes a necessity. We have to give end users more information about the algorithms underlying the technologies on which they rely.
Our technology is able to extract algorithms automatically from a code-base but we need help to make them accessible to everyone. Few people understand code, it is a lot of data and there is no standard representation system for algorithms.
Who we are
Deep Algo is a Data Science Startup at the forefront of the Algorithmic Transparency. We believe that in our data-obsessed world, nobody will tolerate that opaque algorithms are left to take decisions: we need oversight and transparency.
What we do
Deep Algo is a SaaS solution for algorithm visualization. Deep Algo is a powerful tool to get a deep insight into your code. It helps you to document, validate and ensure the transparency of algorithms. Our solution is based on our unique technology. We automatically extract algorithms from code and represent them in a simple format: ICAO (Input, Condition, Action, Output). In the end, Deep Algo opens the code Black Box that rules businesses to make algorithms transparent and accountable.
Objectives
Challenge
We aim at open sourcing the data visualization part of our technology. We are language theoretic, data mining or AI engineers, and we wish to make the community benefits from our expertise by letting it providing brilliant ideas on the front-end part.
Given a code-base, we produce a set of Data Flow Graphs representing the evolution of variables (data) throughout the call-stack of all functions. This yields a huge amount of graphs and each graph can potentially be composed of many nodes and edges.
Our main challenge is to provide a front-end for navigating among these graphs so that a “non-developer” can understand what the application does. By non-developer we mean people that are tightly or loosely involved in an application development process but have no developer background:
- Business analysts
- End users
- Product managers
- Team managers
- …
What we expect from you
The objective of this hackathon is, for you, to propose a GUI to visualize, navigate, interact, etc. with our data.
Prerequisites
In order to enter this hackathon, you need to:
-
 Know how to read code or on the opposite have no idea of what code is
 -
 Have sense of user experience
 -
 Have artistic flair
 -
 Know the JSON format
 -
 Have some knowledge of graphs
 -
 Have a great imagination
 -
 Have a bit of sense of humor is always better
 -
 Love computer science
How to win your hackathon?
The jury will elect the most comprehensive visualization. That is:
- Understandable: those who can’t read code must understand your UI. The jury won’t have access to the code!
- Simple: ease of use
- Technically feasible
- Hot factor – Potential
For the sake of fairness, all participants will present the result of their work on the same set of data.
Input
- Given the time line, and for the sake of simplicity we have chosen a very
simple
Javaapplication of a Poker Texas Hold’em game. - For the sake of simplicity and ease of use, we have chosen to export our
database in a
JSONformat that represents the Data Flow Graphs with all necessary information.
So in summary, you start with these JSON files representing
the entire Poker Texas Hold’em application.
Expected outputs
What matters the most is your ideas! So you can provide any format that best describes them: from a fully functional Web GUI to a deck of slides with static images.
You have questions
- Deep Algo slack
- Open an issue on our Deep Algo GitHub
Other resources
These are the graphical resources we use at Deep Algo. Use them if you like but please feel free to express your own creativity.
Technical matters
From a technical point of view Deep Algo basically constructs a Data Flow Graph out of a codebase. It follows the process below:
- Parse plain text code
- Generate a MongoDB representation based on our in-house Unified Meta Model
- Generate a Control Flow Graph
- Generate a Data Flow Graph
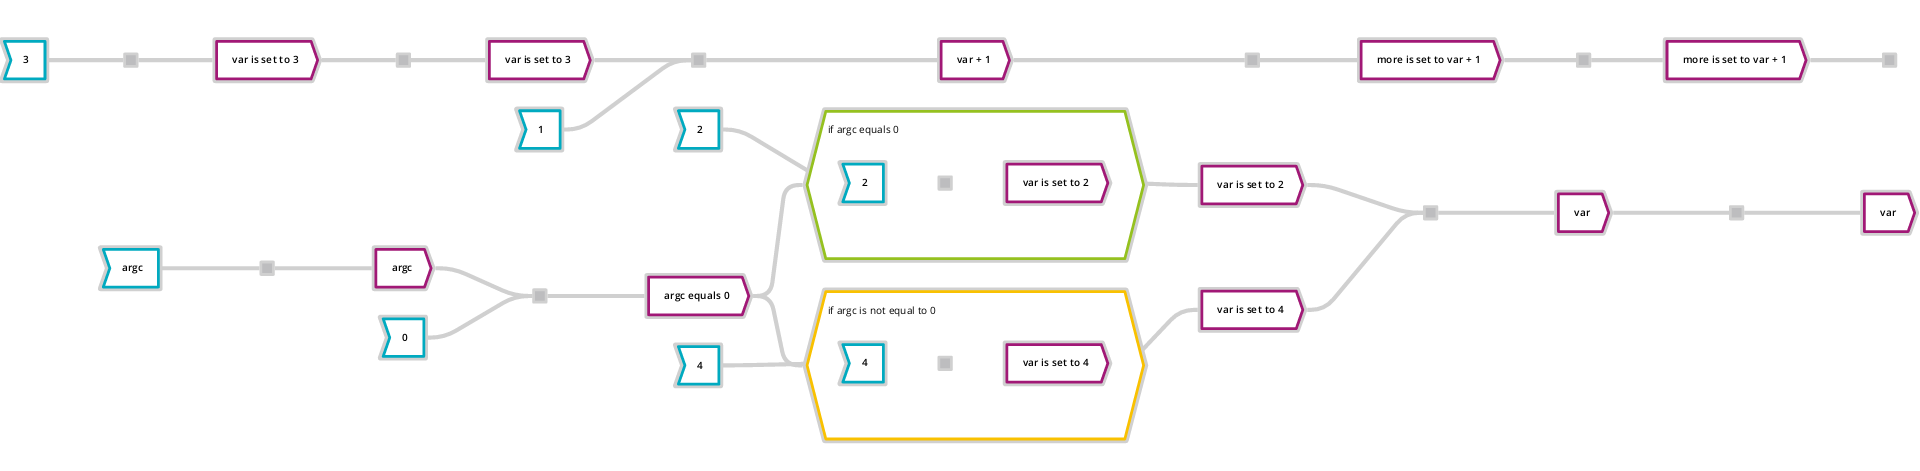
A sample code vs Data Flow Graph can be found here:
int main(int argc, char *argv[])
{
  int var=3;
  int more = var + 1;
  if(argc == 0){
    var = 2;
  }
  else{
    var = 4;
  }
  printf(more);
  return var;
}
Yielding the following DFG :
You can see this in your browser using GoJS or another sample viewer using D3
More information
- Data-Flow Analysis:
- Wikipedia article
- mathematical background:
- Graph visualization:
How to setup your environment?
-
Get a copy of this repository:
-
Clone it using
git:git clone https://github.com/DeepAlgo/HackathonJune2017.git - Or download a ZIP archive of this whole repository
-
Clone it using
-
Find the Poker dataset:
In your copy of the repository, navigate to
samples/poker. Several files are available:-
src/**/*.javaare the Java source files of the Poker game that Deep Algo analyzed. -
dfg/*.jsonare the generated Data Flow Graphs (DFG). The numbers in the file names have no special meaning; however, they uniquely identify a DFG in a the current dataset (Poker) and they are used to link DFGs together, using the fieldcalledGraphIdof the JSON format.
To preview one of the DFGs (e.g.
45.json) using our provided viewer:- open [
dfgviewer/index.html] in a recent web browser - click in the text field at the top and select your sample with a click. You can type the number, the question (How to…) or the name of the code method to find the matching graph.
-
-
Find smaller samples:
We also provide more samples in the same format, so that you can test a few very simple examples:
Folder name Sample samples/mainThe DFG of a simple main()functionsamples/subgraphA simple call to a sub-algorithm, i.e. two linked DFGs samples/loopA DFG with a looping condition
Deep Algo Data Flow Graph
Let’s dig into the real stuff now!
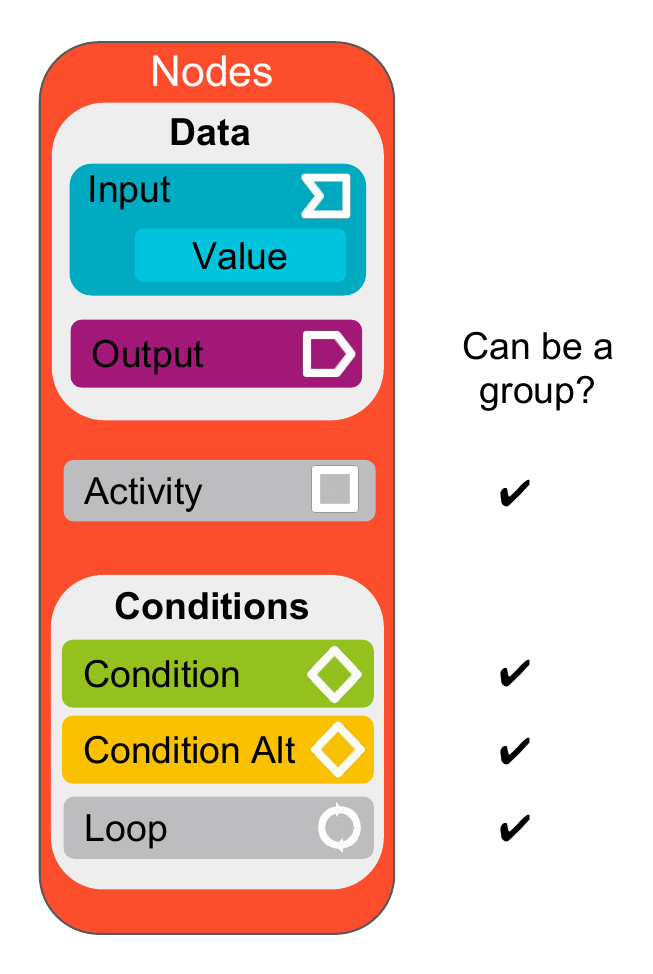
Deep Algo data flow graph is composed of:
-
Nodes: represent three major class of information:
-
Data: a data node corresponds to the state of a variable in the
program. Data nodes are split in 2 sub-classes:
-
Input: any variable in the program. When this variable is a hard
coded value (such as a number or character string) we have sub-class
for that:
-
Value: any literal value (e.g. the integer
42or the string"Bob")
-
Value: any literal value (e.g. the integer
- Output: any variable in the program.
-
Input: any variable in the program. When this variable is a hard
coded value (such as a number or character string) we have sub-class
for that:
-
Activity: an activity node corresponds to an instruction that either
reads or modifies a data. Activity nodes are split many sub classes:
- External function call: a program may call functions defined in other libraries or resources.
- Internal function call: these are instructions that call other functions defined in the application
-
Condition: a condition node corresponds to a one branch of a decision
taken in the program. For example with an
if-elsestructure, the Condition represents the action taken in theif, when the condition is true.-
ConditionAlt: this special kind of condition represents the
alternative path, in the case of an
if-elseit’s the contents of theelse. - Loop: loops are the specific condition that represent a repeated sequence of instructions, as long as the condition is verified.
-
ConditionAlt: this special kind of condition represents the
alternative path, in the case of an
-
Data: a data node corresponds to the state of a variable in the
program. Data nodes are split in 2 sub-classes:
-
Edges: represent the flow between data, activities and conditions.
- In edges: are edges that point to a node.
- Out edges: are edges that point out from a node.
-
Groups: are nodes embedding a sub graph. The set of group nodes are:
- Activity nodes
- Condition nodes, including ConditionAlt and Loop nodes
Following is a schematic view of nodes architecture:
Deep Algo JSON scheme
See the interactive documentation (made with docson)
JSON Samples
Basic

Sub Graph
The caller graph: caller.json

The called graph: callee.json

When assembled in the same view, those two graphs should look like that:

The description is different from the text when multiple values can be found for one data
